Every day your recruiters collect valuable data in their CRM – are you using it to your agency’s advantage? Data storytelling is fast becoming the go-to reporting style for big tech businesses such as Google and Microsoft to smaller companies – including Firefish. Why? Data storytelling is a fast and effective way to learn from your data, focus your business and bring accountability to your team.
By combining data with visuals and a narrative, data storytelling gives a greater context of exactly what’s happening among your recruitment team. It adds the all-important, ‘why’, ‘when’ and ‘how’ data changes over time.
Bring it into your agency and let it highlight your strengths and refine the processes that aren’t bringing you good returns. From there you can laser focus on the activities that bring you the big bucks and drive performance amongst your team.
What makes a data story?
Data stories have three key components:
- Data – The data you want to present, whether this is on a weekly, monthly or quarterly basis.
- Visuals – A visual representation of the data: Your CRM reporting dashboards are perfect for this!
- Narrative – ‘Story’ isn’t as abstract as you’d think, it’s as simple as reporting on a data set that connects to another to create a stronger overview of all activities. From there, your recruiters can make solid plans for the weeks or months ahead.
Now that you know the basics of data storytelling, let’s look at some examples using Firefish report dashboards…
Team dashboard
Building out a team dashboard will give you an accessible overview of your team’s performance as you track the metrics that matter to your business. It’s all about getting to the bottom of what’s working and what’s not – data storytelling can help you do just that!
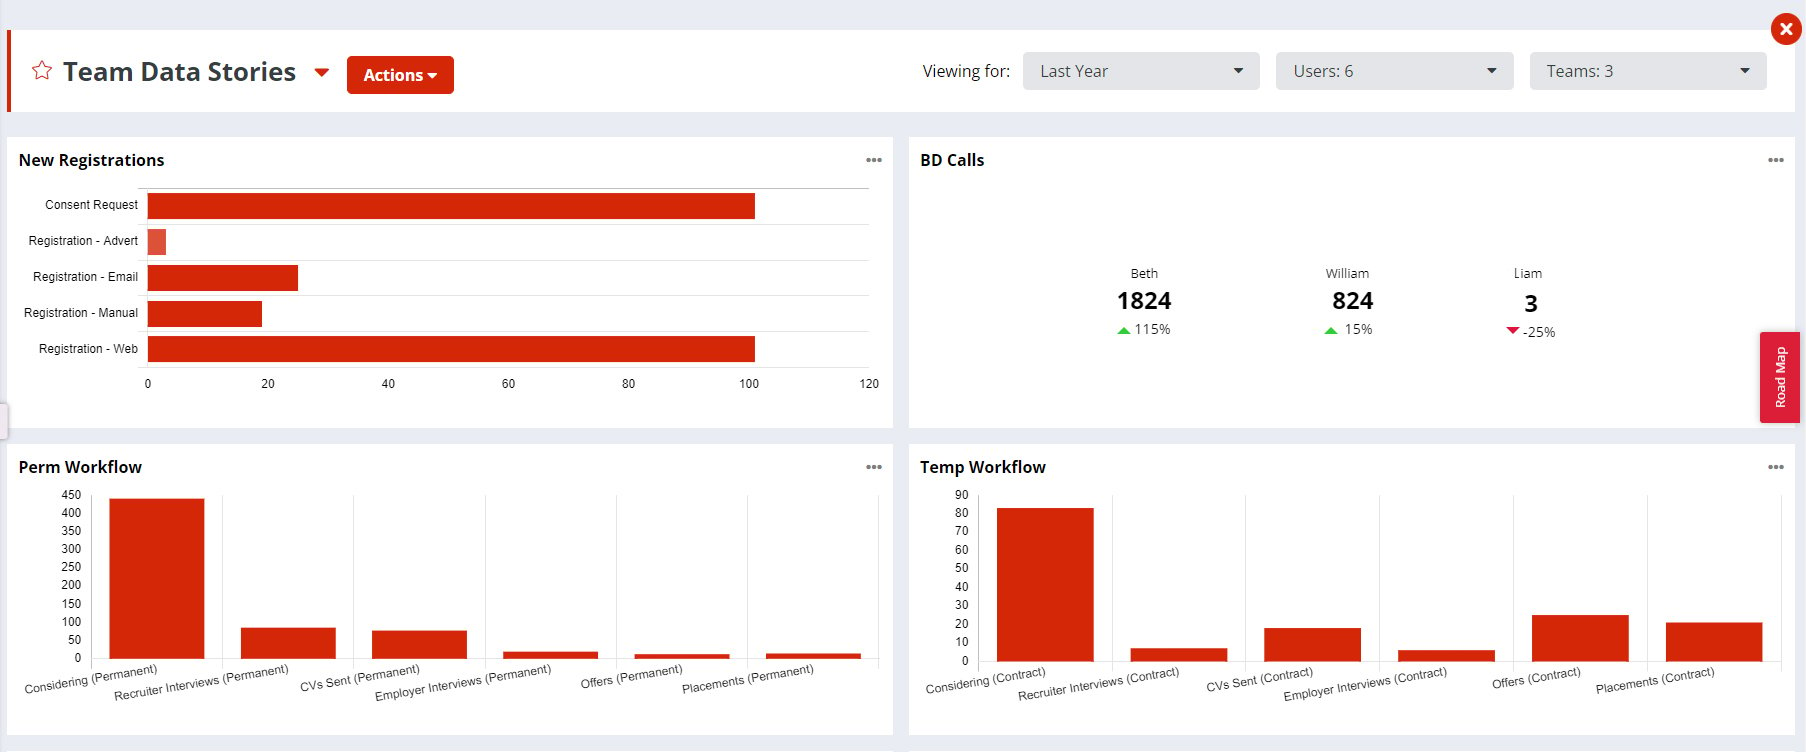
From this data story, it’s easy to see the agency’s strongest channels and the volume of new registrations your recruiters are pulling in week to week. The dashboard also gives you an overview of the team’s Perm and Temp workflows. By bringing a story like this into your weekly meetings, you’ll not only stay up to date with your team’s activity, but you’ll bring accountability (not to mention friendly competition) to your team.
Another major benefit of data storytelling is that it provides plenty of opportunities to coach your team. For example, seeing that a certain recruiter is struggling somewhere along their job workflow gives you full transparency of the situation. From there you can step in and coach them through any problem before it gets too big.
Candidate dashboard
We have a habit in recruitment of focusing everything on a recruiter’s KPIs without giving context to the situation. But by using dashboards and data storytelling, we can begin to bridge that gap and enable recruiters to analyse the data and improve on their outputs.
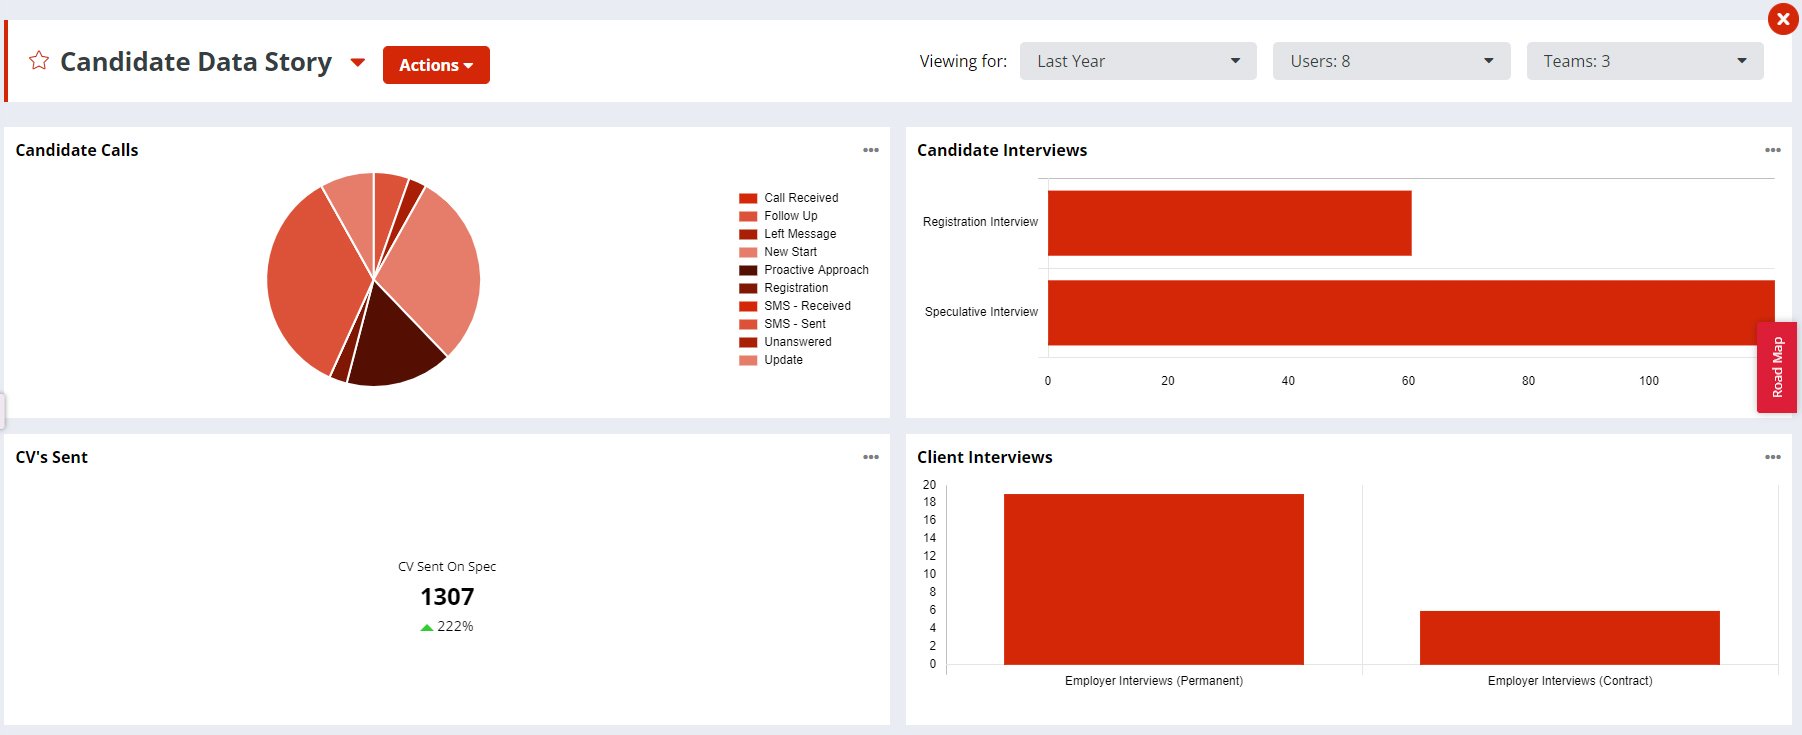
This dashboard tells a story of candidate activity bringing together data on candidate calls right through to the interview stage. From this, it’s clear to see the volume and purpose of candidate calls in relation to candidate interviews and meetings.
Here recruiters are asked to connect activities are being connected in a wider context - something which will help them find any gaps and refine their processes to be more effective. For example, if a recruiter begins to see they are spending a lot of time on follow up calls and not enough time proactively approaching new candidates or re-engaging passive talent, they can work on improving their output in the areas that will benefit your agency in line with market conditions (i.e. a candidate shortage).
Once you’ve empowered your team to take control and report on their own stories, they’ll want nothing more than to talk up their successes every Monday morning – ultimately this is the key to turning them into the best recruiters they can be!

Client dashboard
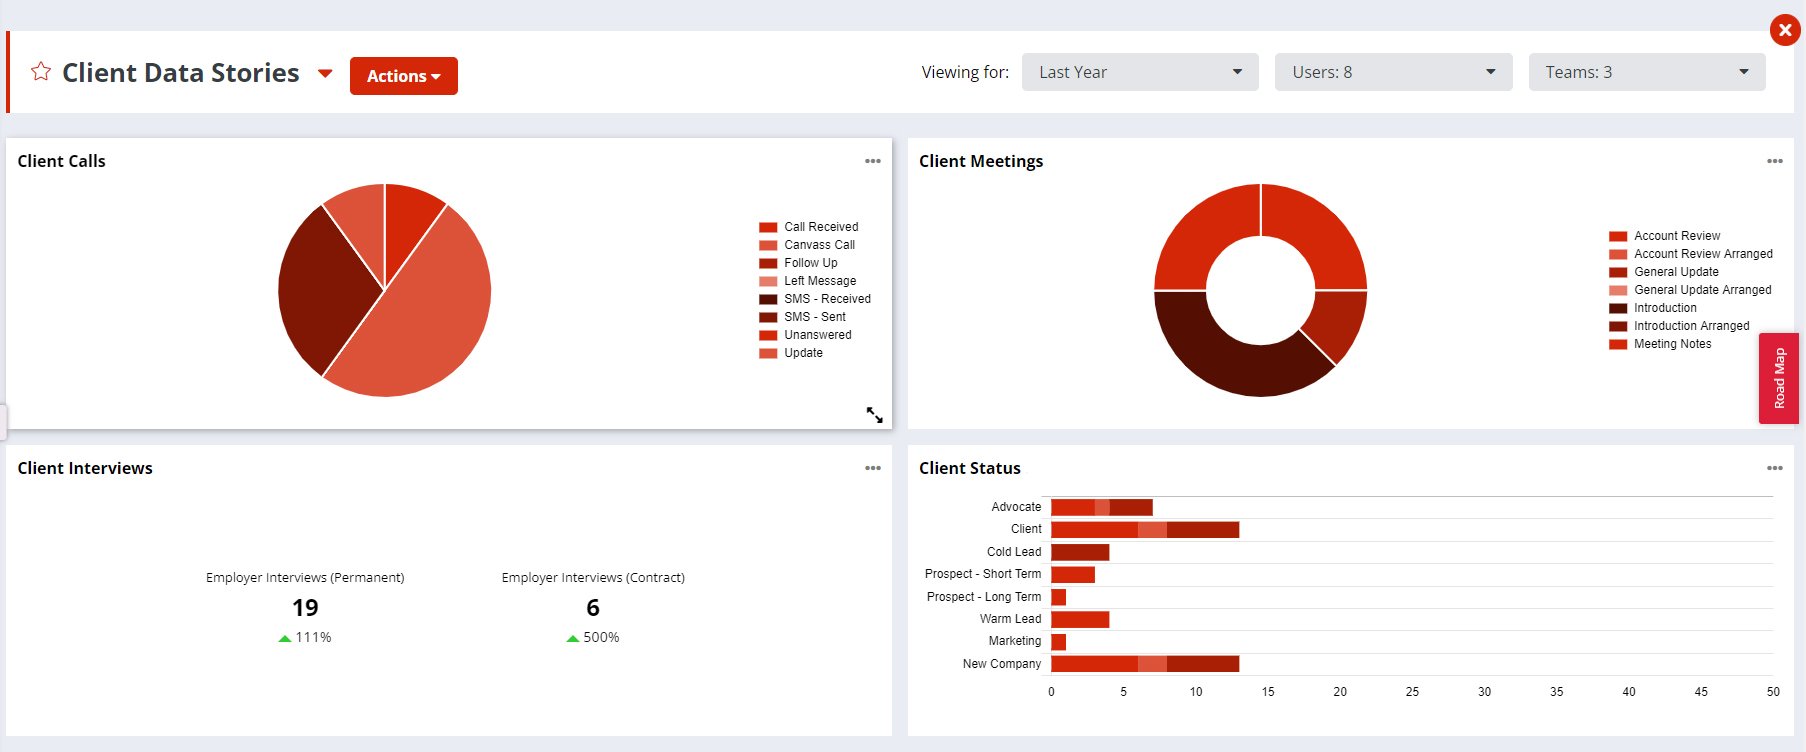
In this final example, this dashboard provides the visuals for a recruiter to tell the story of their weekly client activity. The report gives a visual insight into how many meetings were gained from calls, showing the key business opportunities that come in each week. It also gives an overview of how many interviews have been arranged between candidates and clients across Perm and Temp roles and the overall makeup of the client activity.
While candidate dashboards are important to ensure your team has the talent that’s in high demand, client-centric dashboards are equally important for bringing direction to your business.
Think of it like fast money vs slow money. By getting to know the status of your clients and prospects are at, it’ll become clearer as to exactly where (or rather who) needs to be worked in order to turn prospects into viable placements (or win repeat business from existing clients) – at the heart of it, this is where the money is!
Ready to start driving performance from your CRM? Why not book a demo to find out exactly how Firefish can help.